Skip to content

Instantly share code, notes, and snippets.

@sigon426
Last active July 27, 2017 20:25
Show Gist options
  • Star 0 You must be signed in to star a gist
  • Fork 1 You must be signed in to fork a gist
  • Save sigon426/79f0aaaf25b6f978c0a7 to your computer and use it in GitHub Desktop.
Save sigon426/79f0aaaf25b6f978c0a7 to your computer and use it in GitHub Desktop.
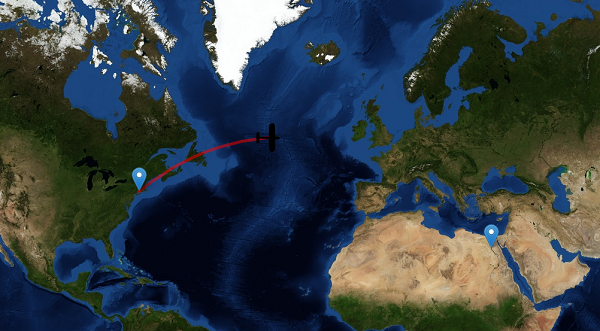
Orthodrome animated flight path

Orthodrome animated flight path

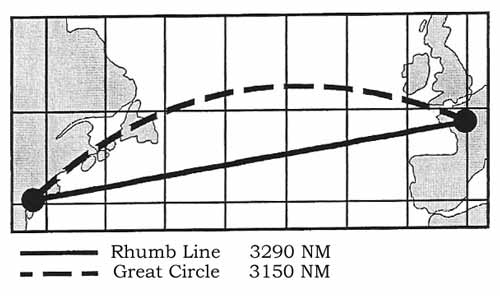
The great-circle or orthodromic distance is the shortest distance between two points on the surface of a sphere, measured along the surface of the sphere (as opposed to a straight line through the sphere's interior).

great circle

Figure: Rhumb line and Great Circle in Mercator projection more

The orthodrome was created with PostGIS following this post by Anita Graser.

UPDATE geodeticlines
SET the_geom = 
(SELECT ST_Transform(ST_Segmentize(ST_MakeLine(
       ST_Transform(a.the_geom, 953027),
       ST_Transform(b.the_geom, 953027)
     ), 100000), 4326 ) 
 FROM salidas a, llegadas b

)

The plane was animated with the AnimatedMarker Leaflet plugin.

Adding points to the orthodroma in an animation use code from this mapbox's post.

orthodrome

L.AnimatedMarker = L.Marker.extend({
options: {
// meters
distance: 200,
// ms
interval: 1000,
// animate on add?
autoStart: true,
// callback onend
onEnd: function(){},
clickable: false
},
initialize: function (latlngs, options) {
this.setLine(latlngs);
L.Marker.prototype.initialize.call(this, latlngs[0], options);
},
// Breaks the line up into tiny chunks (see options) ONLY if CSS3 animations
// are not supported.
_chunk: function(latlngs) {
var i,
len = latlngs.length,
chunkedLatLngs = [];
for (i=1;i<len;i++) {
var cur = latlngs[i-1],
next = latlngs[i],
dist = cur.distanceTo(next),
factor = this.options.distance / dist,
dLat = factor * (next.lat - cur.lat),
dLng = factor * (next.lng - cur.lng);
if (dist > this.options.distance) {
while (dist > this.options.distance) {
cur = new L.LatLng(cur.lat + dLat, cur.lng + dLng);
dist = cur.distanceTo(next);
chunkedLatLngs.push(cur);
}
} else {
chunkedLatLngs.push(cur);
}
}
chunkedLatLngs.push(latlngs[len-1]);
return chunkedLatLngs;
},
onAdd: function (map) {
L.Marker.prototype.onAdd.call(this, map);
// Start animating when added to the map
if (this.options.autoStart) {
this.start();
}
},
animate: function() {
var self = this,
len = this._latlngs.length,
speed = this.options.interval;
// Normalize the transition speed from vertex to vertex
if (this._i < len) {
speed = this._latlngs[this._i-1].distanceTo(this._latlngs[this._i]) / this.options.distance * this.options.interval;
}
// Only if CSS3 transitions are supported
if (L.DomUtil.TRANSITION) {
if (this._icon) { this._icon.style[L.DomUtil.TRANSITION] = ('all ' + speed + 'ms linear'); }
if (this._shadow) { this._shadow.style[L.DomUtil.TRANSITION] = 'all ' + speed + 'ms linear'; }
}
// Move to the next vertex
this.setLatLng(this._latlngs[this._i]);
this._i++;
// Queue up the animation to the next next vertex
this._tid = setTimeout(function(){
if (self._i === len) {
self.options.onEnd.apply(self, Array.prototype.slice.call(arguments));
} else {
self.animate();
}
}, speed);
},
// Start the animation
start: function() {
this.animate();
},
// Stop the animation in place
stop: function() {
if (this._tid) {
clearTimeout(this._tid);
}
},
setLine: function(latlngs){
if (L.DomUtil.TRANSITION) {
// No need to to check up the line if we can animate using CSS3
this._latlngs = latlngs;
} else {
// Chunk up the lines into options.distance bits
this._latlngs = this._chunk(latlngs);
this.options.distance = 10;
this.options.interval = 30;
}
this._i = 1;
}
});
L.animatedMarker = function (latlngs, options) {
return new L.AnimatedMarker(latlngs, options);
};
<!DOCTYPE html>
<html>
<head>
<title>Orthodroma</title>
<meta charset="utf-8" />
<meta name="viewport" content="width=device-width, initial-scale=1.0, maximum-scale=1.0, user-scalable=no" />
<link rel="stylesheet" href="http://cdn.leafletjs.com/leaflet-0.7.1/leaflet.css" />
<style>
body {
padding: 0;
margin: 0;
}
html, body, #map {
height: 100%;
}
</style>
</head>
<body>
<div id="map"></div>
</body>
<script src="http://cdn.leafletjs.com/leaflet-0.7.1/leaflet.js?2"></script>
<script src="orthodroma.js"></script>
<script src="AnimatedMarker.js"></script>
<script type="text/javascript">
var InitialCenter = new L.LatLng(41, -72);
var map = L.map('map');
map.setView(InitialCenter, 3);
var MapQuest = L.tileLayer('http://oatile{s}.mqcdn.com/tiles/1.0.0/sat/{z}/{x}/{y}.jpg', {
attribution: 'Tiles Courtesy of <a href="http://www.mapquest.com/">MapQuest</a> &mdash; Portions Courtesy NASA/JPL-Caltech and U.S. Depart. of Agriculture, Farm Service Agency',
subdomains: '1234',
maxZoom:11
}).addTo(map);;
// add a new line to the map, but one with no points - yet
var polyline = L.polyline([],{
color:'red'
}).addTo(map);
// keep a tally of how many points we've added to the map
var pointsAdded = 0;
var linea1 =orthodroma2.features[0].geometry.coordinates;
var pointsTobeAdded= linea1.length
// start adding new points to the map
add();
function add() {
// addLatLng takes a new latLng location and puts it at the end of the line
polyline.addLatLng(
L.latLng(linea1[pointsAdded][1],linea1[pointsAdded][0])
);
// pan the map along with where the line is being added.
map.setView([linea1[pointsAdded][1],linea1[pointsAdded][0]], 3);
if (++pointsAdded < pointsTobeAdded) window.setTimeout(add, 100);
};//end add()
lines= L.geoJson(orthodroma2,{
onEachFeature:onEachFeature
});
var lines, route, coorSalida, coorLlegada;
var myIcon = L.icon({
iconUrl: 'plane.png',
iconAnchor: [20, 24], // point of the icon which will correspond to marker's location
});
function onEachFeature(feature, layer) {
var array = feature.geometry.coordinates
var myArray =[];
var last=array.length-1
coorSalida = [array[0][1], array[0][0]]
coorLlegada = [array[last][1], array[last][0]]
console.log('llegada: '+coorLlegada+' salida: '+coorSalida)
for (var i = 0; i <= array.length-1; i++) {
console.log([array[i][1], array[i][0]]);
myArray.push([array[i][1], array[i][0]])
};
route = L.polyline(myArray);
console.log(route)
}
var salida = L.marker(coorSalida).addTo(map);
var llegada = L.marker(coorLlegada).addTo(map);
var animatedMarker = L.animatedMarker(route.getLatLngs(), {
icon: myIcon,
distance: 9200, // meters
interval: 10, // milliseconds
});
map.addLayer(animatedMarker);
</script>
</html>
var orthodroma1={"type":"FeatureCollection","features":[{"type":"Feature","properties":{"cartodb_id":8,"name":"vuelo","description":null,"created_at":"2014-04-29T22:42:31Z","updated_at":"2014-04-29T22:52:51Z"},"geometry":{"type":"LineString","coordinates":[[-72.822876,41.335576],[-72.34149,42.153665],[-71.844413,42.968971],[-71.330924,43.781354],[-70.80026,44.590668],[-70.251619,45.396757],[-69.684149,46.199454],[-69.096953,46.998582],[-68.489082,47.793952],[-67.859531,48.585362],[-67.207242,49.372598],[-66.531092,50.15543],[-65.829898,50.933612],[-65.102409,51.706883],[-64.347303,52.47496],[-63.563186,53.237545],[-62.748587,53.994315],[-61.901955,54.744926],[-61.021657,55.489009],[-60.105975,56.22617],[-59.153106,56.955983],[-58.161156,57.677995],[-57.128146,58.391718],[-56.052009,59.096631],[-54.930593,59.792173],[-53.761666,60.477745],[-52.542921,61.152705],[-51.271986,61.816364],[-49.946436,62.467989],[-48.563809,63.106794],[-47.121626,63.731941],[-45.617416,64.342541],[-44.048748,64.937646],[-42.41327,65.516251],[-40.708751,66.077297],[-38.933135,66.619667],[-37.0846,67.142188],[-35.161629,67.643638],[-33.163082,68.122747],[-31.08828,68.578204],[-28.93709,69.008665],[-26.710014,69.412768],[-24.408279,69.789141],[-22.033915,70.136418],[-19.589828,70.453259],[-17.079858,70.738371],[-14.508809,70.990523],[-11.882457,71.208577],[-9.207521,71.391504],[-6.491605,71.538409],[-3.743095,71.64855],[-0.971029,71.72136],[1.815073,71.756455],[4.605397,71.753651],[7.390037,71.712961],[10.15921,71.634601],[12.903454,71.518982],[15.61382,71.366699],[18.282029,71.178517],[20.900603,70.955352],[23.462959,70.69825],[25.963464,70.408367],[28.397457,70.086941],[30.761241,69.735275],[33.052042,69.354715],[35.267953,68.946627],[37.40786,68.512383],[39.471362,68.053345],[41.458676,67.57085],[43.370556,67.066204],[45.208202,66.540671],[46.973182,65.995467],[48.667355,65.431755],[50.292808,64.850643],[51.851791,64.253185],[53.346673,63.640376],[54.779892,63.013153],[56.153921,62.372401],[57.471239,61.718948],[58.734303,61.053572],[59.945532,60.377001],[61.107288,59.689915],[62.221869,58.99295],[63.291493,58.2867],[64.318302,57.571719],[65.30435,56.848523],[66.251602,56.117595],[67.161939,55.379385],[68.037151,54.634312],[68.878945,53.882767],[69.68894,53.125116],[70.468675,52.361699],[71.21961,51.592835],[71.943129,50.818821],[72.640541,50.039935],[73.313089,49.256437],[73.961946,48.468569],[74.588225,47.67656],[75.192977,46.880622],[75.777196,46.080954],[76.341826,45.277745],[76.887756,44.471169],[77.41583,43.661391],[77.926845,42.848567],[78.421557,42.032841],[78.900681,41.214351],[79.364894,40.393225],[79.814838,39.569586],[80.251121,38.743546],[80.674321,37.915214],[81.084982,37.084692],[81.483625,36.252076],[81.870742,35.417456],[82.2468,34.580918],[82.612242,33.742544],[82.967491,32.902409],[83.312948,32.060588],[83.648994,31.217147],[83.975992,30.372154],[84.294286,29.52567],[84.604206,28.677754],[84.902344,27.839076]]}}]};
var orthodroma2={"type":"FeatureCollection","features":[{"type":"Feature","properties":{"cartodb_id":9,"name":"vuelo2","description":null,"created_at":"2014-04-29T22:55:43Z","updated_at":"2014-04-29T23:01:16Z"},"geometry":{"type":"LineString","coordinates":[[-72.630615,41.372686],[-71.714918,41.922283],[-70.779517,42.461867],[-69.824153,42.991116],[-68.848593,43.509698],[-67.852628,44.017276],[-66.836075,44.513505],[-65.798785,44.998032],[-64.740643,45.470501],[-63.661572,45.93055],[-62.561534,46.37781],[-61.44054,46.811912],[-60.298646,47.232481],[-59.135963,47.639143],[-57.952654,48.031519],[-56.748943,48.409234],[-55.525116,48.771912],[-54.281523,49.119183],[-53.018579,49.450677],[-51.736773,49.766032],[-50.436661,50.064894],[-49.118873,50.346916],[-47.784114,50.611763],[-46.43316,50.859112],[-45.066862,51.088654],[-43.68614,51.300094],[-42.291986,51.493157],[-40.885458,51.667586],[-39.467679,51.823145],[-38.039829,51.959619],[-36.603144,52.076818],[-35.158908,52.174576],[-33.708448,52.252753],[-32.253124,52.311237],[-30.794328,52.349943],[-29.333467,52.368815],[-27.871965,52.367825],[-26.411247,52.346974],[-24.952734,52.306293],[-23.497833,52.245841],[-22.047933,52.165706],[-20.604391,52.066004],[-19.16853,51.946875],[-17.741629,51.80849],[-16.32492,51.65104],[-14.919576,51.474742],[-13.526715,51.279835],[-12.147388,51.066577],[-10.782578,50.835247],[-9.433202,50.586139],[-8.100102,50.319565],[-6.784046,50.035849],[-5.485732,49.735327],[-4.205782,49.418346],[-2.944747,49.085263],[-1.703106,48.73644],[-0.48127,48.372246],[0.720418,47.993052],[1.901679,47.599235],[3.062297,47.19117],[4.202111,46.769235],[5.321017,46.333804],[6.418964,45.885252],[7.495947,45.423949],[8.552006,44.950262],[9.587223,44.464552],[10.601716,43.967176],[11.595638,43.458486],[12.569175,42.938825],[13.522537,42.408531],[14.455963,41.867934],[15.36971,41.317357],[16.264057,40.757115],[17.139298,40.187516],[17.995743,39.608858],[18.833713,39.021432],[19.653539,38.425521],[20.45556,37.8214],[21.240121,37.209334],[22.007574,36.589582],[22.758272,35.962394],[23.49257,35.328013],[24.210825,34.686673],[24.913394,34.0386],[25.60063,33.384014],[26.272888,32.723127],[26.930518,32.056144],[27.573864,31.383262],[28.203272,30.704672],[28.819077,30.020559],[29.421613,29.3311],[30.011208,28.636466],[30.588184,27.936824],[30.761719,27.722436]]}}]};
@phpmind
Copy link

phpmind commented Jun 23, 2016

very cool

Sign up for free to join this conversation on GitHub. Already have an account? Sign in to comment