If you're new to CartoDB, making an account is easy. Just click THIS LINK and follow the instructions. These accounts are a level-up from our standard free accounts because we <3 you!
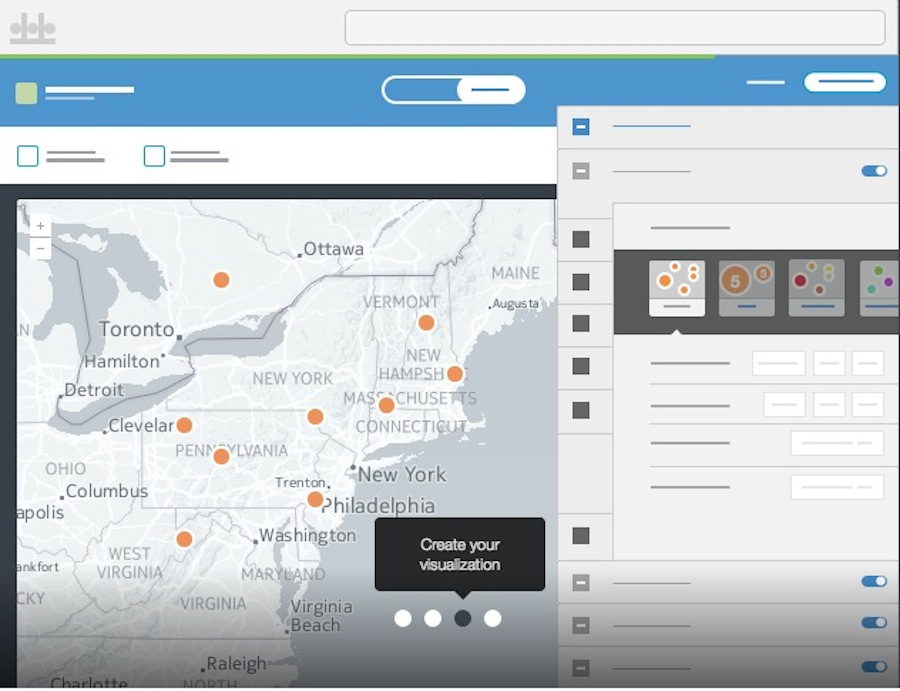
The Dashboard is like the command center for managing your datasets, maps, and account.

The blue bar on top allows you to:
- Navigate between your maps and datasets
- Datasets are the backbone of your map visualization. It is important to note that by switching to the datasets view, you can work with the data stored on the CartoDB database directly.
- Visit our CartoDB gallery
- Learn new skills on our documentation page.
By clicking the icon on the far right you can:
- Manage your account settings
- Visit your public profile
- View your API key
- Which will be important for using our APIs and some external tools such as OGR.

Let's begin by clicking the green New Map button. Then choosing to Make a map from scratch in the popup.

There are many ways to bring data into CartoDB.

From this area you can choose to:
- Create an empty map with no data
- Browse our ever growing data library
- Make a map with datasets you have already brought into CartoDB, or
- Connect a new dataset.
- This allows you to choose files from your computer, URL, or one of our connectors such as Twitter.
Keep in mind that you can also drag and drop datasets onto your dashboard at anytime and let CartoDB take care of the rest!
####Today we're going to be looking at crimes in Boston.
#Let's begin by bringing in crimes in Boston on Thursdays by command-clicking (or right clicking) on THIS LINK and selecting to "Copy Link Address".
- Using a URL allows you to skip bringing data onto your computer as well as allowing users with certain plans to create automatically syncing and real-time maps
The CartoDB editor makes it easy to style your map, and run analysis or query your data.

- Tour of the Wizard
###CartoCSS
The Style Wizard allows you to easily tap into CartoDB's Map design language CartoCSS. with our built in sandbox.

The basic Syntax for CartoCSS is:
selector {
  property: value;
}
Map {
marker-fill: #ffcc00;
}- Changes you make in the wizard change the CartoCSS.
- By working with the CartoCSS directly, the styling possibilities are endless!
- Let us explore some conditional syling
- We can style in CartoCSS directly from your data
What if we want to style crimes over the summer differently?
  [month > 4] {
    marker-fill: #66c2a5;
    marker-width: 5;
    }
Or what if we want to point out only auto thefts?
 [incident_type_description = "AUTO THEFT"] {
   marker-file: url(http://com.cartodb.users-assets.production.s3.amazonaws.com/maki-icons/car-18.svg);
   marker-fill: red;
   marker-width: 15;
   marker-type: ellipse;
 }
By returning to the unser interface, the CartoCSS sandbox can be cleared.
Let's filter out everything but Aggravated Assaults.
#Layer [incident_type_description != "AGGRAVATED ASSAULT"] {
marker-line-opacity: 0;
marker-fill: transparent;
}
The != means not equal to. Inside of that statement, lets identify which crimes occured with a firearm or a knife.
  [weapontype = "Knife"] {
    marker-fill: #fc8d62;
    marker-width: 6;
  }
  [weapontype = "Firearm"] {
    marker-fill: #8da0cb;
    marker-width: 6;
  }
#CartoCSS in Torque
Introduction to: duration, steps, trails, resolution

#traffic_accidents[frame-offset=2] {
 marker-width:10;
 marker-fill-opacity:0.225;
}
Offsets relate directly to -torque-frame-count:512;
Map {
-torque-frame-count:512;
-torque-animation-duration:30;
-torque-time-attribute:"cartodb_id";
-torque-aggregation-function:"CDB_Math_Mode(torque_category)";
-torque-resolution:2;
-torque-data-aggregation:linear;
}It's SQL embedded in CartoCSS!
CDB_Math_Mode(district_i)count(*)sum(income)Map {
-torque-frame-count:256;
-torque-animation-duration:30;
-torque-time-attribute:"fromdate";
-torque-aggregation-function:"count(cartodb_id)";
-torque-resolution:2;
-torque-data-aggregation:linear;
}
#boston_crime_incident_reports_jan_aug_2015{
comp-op: lighter;
marker-fill-opacity: 0.9;
marker-line-color: #FFF;
marker-line-width: 0;
marker-line-opacity: 1;
marker-type: ellipse;
marker-width: 2;
marker-fill: #F84F40;
}
#boston_crime_incident_reports_jan_aug_2015[value>2] {
marker-width:5;
}
#boston_crime_incident_reports_jan_aug_2015[value>3] {
marker-width:12;
}
#boston_crime_incident_reports_jan_aug_2015[value>4] {
marker-width:15;
}
#boston_crime_incident_reports_jan_aug_2015[frame-offset=1] {
marker-width:3.5;
marker-fill-opacity:0.2;
}
#boston_crime_incident_reports_jan_aug_2015[frame-offset=2] {
marker-width:5.5;
marker-fill-opacity:0.1;
}
###Using SQL (Structured Query Language)
The CartoDB platform is built on the PostgreSQL database, which and PostGIS which make it an incredibly robust tool for working with spatial data!
In the editor itself, it's easy to filter your datasets by using the built in SQL API.
Similar to the Styling Wizard, the 'filters' tab allows you to run queries against your datasets easily, while also making changes to lines of code in the 'SQL' tab.

###Basic Syntax
The most basic statement is:
SELECT * FROM table_nameThe * means 'all' columns in the table table_name.
Something a bit more complex may be (just an example):
SELECT
  name,
  height,
  fathers_name
FROM
  people_doing_the_workshop
WHERE
  favorite_cookie = 'pecan'
  AND (
    height < 1.8
    AND
    height > 1.6
  )
RESULT:
name | height | fathers_name
----------------------------
andy |   1.7  | peter
SELECT: columns you are requestingFROM: table the data is being pulled fromWHERE: conditions to filter out rows
Once you run an SQL statement, CartoDB allows you to to create a new dataset from your selection, but we won't be doing that today.

Once again the data we are using (Same as above): Crime Incidents in Boston January - August 2015 from the Boston Open Data Portal https://eschbacher.cartodb.com/api/v2/sql?q=select%20*%20from%20eschbacher.boston_crime_incident_reports_jan_aug_2015&format=geojson&filename=boston_crime_incident_reports_jan_aug_2015
Filter for all crimes tagged as ROBBERY
SELECT *
FROM boston_crime_incident_reports_jan_aug_2015
WHERE incident_type_description ILIKE '%ROBBERY%'
The ILIKE portion is a general string match, where the % means the string can begin or end with 0 or more characters, but ROBBERY has to be in the string somewhere. The I piece means the string can be upper or lower case. The following match: AROBBERY, Robbery, xRoBbErYx all match.
These don't: ROBbbbery, AROBBxERY, etc.
Logical Expressions
We can chain on some other conditions to map other crimes but putting OR plus an additional constraint like incident_type_description ILIKE '%LARCENY%'.
But putting AND you increase the granularity if your filter. This will get all incidents marked as some type of larceny or robbery in the months of May and June:
SELECT *
FROM boston_crime_incident_reports_jan_aug_2015
WHERE
  (incident_type_description ilike '%larceny%' OR incident_type_description ilike '%robbery%')
 AND
  (fromdate >= '2015-05-01' AND fromdate < '2015-07-01')
Notice that we can do greater than, equal to, or less than comparisons using dates and strings.
Grouping data by attribute values
We can get summary information about certain columns like comparing the number of crimes on specific days of the week if we group by days:
SELECT
  day_week,
  count(*) As num_crimes
FROM
  boston_crime_incident_reports_jan_aug_2015
GROUP BY
  day_week
Groups of groups
We can get more of a story behind this by digging into the most common crimes on those days by doing the following query:
WITH cte AS (
  SELECT
    incident_type_description,
    day_week,
    count(*) As num_crimes
  FROM
    boston_crime_incident_reports_jan_aug_2015
  GROUP BY
    day_week,
    incident_type_description)

SELECT *
FROM cte
WHERE num_crimes > 100
ORDER BY day_week ASC, num_crimes DESC
Querying with location data
But this is just numbers and strings! What about LOCATION? CartoDB handles geographical data within the database, too :)
Find all crimes within 1000 meters of Boston Commons
SELECT
  *
FROM
  boston_crime_incident_reports_jan_aug_2015
WHERE
  ST_DWithin(the_geom, CDB_LatLng(42.3551128, -71.0677762), 1000, true)
Here's the CartoCSS I used to visualize this:
#boston_crime_incident_reports_jan_aug_2015{
  marker-fill-opacity: 0.9;
  marker-line-color: #5CA2D1;
  marker-line-width: 1.2;
  marker-line-opacity: 1;
  marker-placement: point;
  marker-type: ellipse;
  marker-width: 5;
  marker-fill: transparent;
  marker-allow-overlap: true;
  marker-comp-op: color-dodge;
}

#boston_crime_incident_reports_jan_aug_2015::labels {
  text-name: [incident_type_description];
  text-face-name: 'Lato Regular';
  text-size: 12;
  text-label-position-tolerance: 10;
  text-fill: #e1e1e1;
  text-halo-fill: #333333;
  text-halo-radius: 1;
  text-dy: -10;
  text-allow-overlap: false;
  text-placement: point;
  text-placement-type: simple;
}
Calculating distances and draw lines between points
Draw a line from Boston Commons to all crimes within 400 meters:
SELECT
  ST_Transform(ST_MakeLine(the_geom, CDB_LatLng(42.3551128, -71.0677762)), 3857) As the_geom_webmercator,
  ST_Distance(the_geom::geography, CDB_LatLng(42.3551128, -71.0677762)::geography),
  cartodb_id
FROM
  boston_crime_incident_reports_jan_aug_2015
WHERE
  ST_DWithin(the_geom, CDB_LatLng(42.3551128, -71.0677762), 400, true)
####Publishing maps
- Title & Metadata
- Adding elements
- Annotations
- Infowindows & legends
- Publishing your map
- Share on Twitter!
- Map Academy
- Beginner
- Map design
- CartoDB.js – build a web app to visualize your data, allowing for more user interaction
- SQL and PostGIS – slice and dice your geospatial data
- CartoDB Tutorials
- CartoDB Editor Documentation
- CartoDB APIs
- Community help on StackExchange
- CartoDB Map Gallery
#Thank You!