Many smart folks have been writing about data visualization lately, and there are lots of great resources available on the internet and in your favorite book store. There is one aspect of data visualization, however, that doesn’t seem to get much love—testing. That’s a shame, because effective testing, especially when it’s part of the initial planning for a visualization, is one of the best ways of ensuring high quality results.
Last active
September 6, 2015 18:08
-
-
Save sathomas/dcb31c1de5940d2fca9c to your computer and use it in GitHub Desktop.
Automated Visualization Testing
Many smart folks have been writing about data visualization lately, and there are lots of great resources available on the internet and in your favorite book store. There is one aspect of data visualization, however, that doesn’t seem to get much love—testing. That’s a shame, because effective testing, especially when we include it as part of the initial planning for the project, can make a big difference in the results.
Let me note from the start that formal testing isn’t always appropriate. For example, if you’re creating a one-time visualization for a static or mostly static web page, you (or your editor) can look at the page and know when the visualization is complete and correct. You can probably forgo a formal test suite. As visualization developers, though, we’re not always lucky enough to have that kind of certainty. Here are some scenarios that benefit from formal testing:
-
You don’t know the input dataset. If you’re creating a dashboard visualization, for example, you typically won’t know the data values in advance. A formal test strategy can help make sure that your visualization correctly handles all of the possible input datasets.
-
You expect to revise the visualization. If you’re developing a visualization in stages, you’ll want to make sure that later revisions don’t break your previous work. A formal test suite makes it easy to check your modifications as you make them, alerting you to new problems as soon as you introduce them.
-
You prefer test-driven development. Test driven development (TDD) is a software development process in which you write tests before you write code. Although this approach might seem backwards, it soon becomes quite natural and is preferred by many developers (including me). If TDD is your methodology of choice, then you’ll need test suites for your visualizations.
Fortunately, if you’re developing your visualizations in JavaScript, there are lots of good testing tools and resources. This visualization shows how I typically incorporate tests in a visualization project.
The visualization itself is nothing fancy. It’s just a basic bar chart implemented in D3.js. The implementation includes a few transitions and it responds dynamically to the window size. These extra features are included to demonstrate some of the more tricky aspects of testing. The complete implementation is in the file chart.js.
The more interesting aspects of this visualization are the tools and the test code. I’ll briefly describe each.
There are lots of good JavaScript testing stacks, but I prefer to use a combination of four separate libraries:
- Mocha is the workhorse testing library. It conducts the tests and reports the results. Mocha works equally well in a web browser or from the Node.js command line.
- Chai Assertion Library is an assertion library. You use it to define your tests in a (mostly) easy-to-read document.
- Sinon.JS provides utilities to simulate a production environment within a test suite. These utilities (technically called spies, stubs, and mocks) take the place of external libraries, REST APIs, etc. in your test environment. [This particular visualization doesn't require Sinon.JS, so you won’t find it in the code below; I do find the library helpful in many visualizations, however.]
- Blanket.js measures the coverage of your tests. It can tell you how much of your code the tests actually exercise, and it identifies code that isn’t covered by the tests.
If you want to see these tools in action on the sample code, you’ll need to install them on your local computer. The easiest way to do that is to clone this repository locally and then execute the command npm install in its main folder. Of course, you’ll need to have Node.js installed as well.
The main test code for the visualization exists in a separate file: chart.test.js. Good tests are supposed to be self-explanatory, so if I’ve done a good job, you should be able to look at that file and follow the test logic.
There are two different ways to execute the tests for the visualization. One way is to load the test.html file in a web browser. That file will execute the tests and report the results:
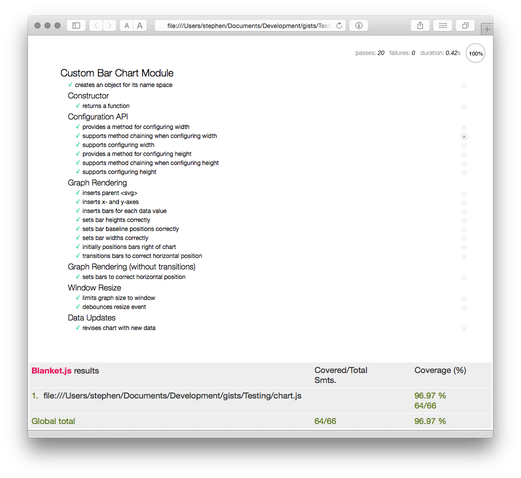
As you can see, the page shows the results of all the tests, and it includes a coverage report at the bottom. The real page is interactive, so you can click on various sections to see more details. Clicking on the coverage report, for example, reveals exactly which lines of code were tested and which were not.
Browser-based testing is great for development, but we might also want to include our tests in an automated build process. In that case, we’ll want to run them from the command line and check the exit status. That’s also easy to do in this example; just execute the command npm test from the project’s main folder. That command runs (essentially) the same tests and reports the results.
$ npm test

  Custom Bar Chart Module
    ✓ creates an object for its name space
    Constructor
      ✓ returns a function
    Configuration API
      ✓ provides a method for configuring width
      ✓ supports method chaining when configuring width
      ✓ supports configuring width
      ✓ provides a method for configuring height
      ✓ supports method chaining when configuring height
      ✓ supports configuring height
    Graph Rendering
      ✓ inserts parent <svg>
      ✓ inserts x- and y-axes
      ✓ inserts bars for each data value
      ✓ sets bar heights correctly
      ✓ sets bar baseline positions correctly
      ✓ sets bar widths correctly
      ✓ initially positions bars right of chart
    Graph Rendering (without transitions)
      ✓ sets bars to correct horizontal position
    Window Resize
      ✓ limits graph size to window
      ✓ debounces resize event
    Data Updates
      ✓ revises chart with new data

  19 passing (595ms)
This file contains bidirectional Unicode text that may be interpreted or compiled differently than what appears below. To review, open the file in an editor that reveals hidden Unicode characters.
Learn more about bidirectional Unicode characters
| /* | |
| * This module implements a simple bar chart. Its architecture is based on | |
| * Mike Bostock’s [reusable chart](http://bost.ocks.org/mike/chart/) approach. | |
| * | |
| * Usage: | |
| * // create a chart module, optionally specifying its size | |
| * var chart = d3.custom.barChart().width(640).height(480); | |
| * // ... | |
| * // select a DOM element, bind a data set to it, and draw the chart | |
| * d3.select("#chart").datum(data).call(chart); | |
| * // ... | |
| * // update chart with new data | |
| * d3.select("#chart").datum(newdata).call(chart); | |
| * // ... | |
| * // update chart without using transitions | |
| * d3.select("#chart").datum(newdata).call(chart, false); | |
| * // ... | |
| * // remove the chart from the page | |
| * chart.remove(); | |
| * | |
| * Data input is an array of objects: | |
| * data = [ | |
| * { label: "string", value: number }, | |
| * { label: "string", value: number }, | |
| * { label: "string", value: number }, | |
| * // ... | |
| * ]; | |
| */ | |
| /* | |
| * To avoid global namespace pollution, we “borrow” the `d3` namespace to host | |
| * our chart module. Since this chart depends on D3, we just assume that the | |
| * D3 library is present without bothering to make sure (e.g. with require.js) | |
| * This also helps to keep the example simple so we can focus on the relevant | |
| * parts of the code. | |
| */ | |
| d3.custom = d3.custom || {}; | |
| /* | |
| * With a stunning lack of originality, we name our module `barChart`. | |
| */ | |
| d3.custom.barChart = function module() { | |
| // Chart options with default values | |
| // --------------------------------- | |
| var margin = { top: 50, right: 50, bottom: 50, left: 50 }, | |
| height = 476, | |
| width = 636 | |
| // Private variables | |
| // ----------------- | |
| var svg = null, // SVG container for the chart | |
| sel = null; // D3 selection for chart | |
| // Private functions | |
| // ----------------- | |
| // Define a standard debounce utility function. If a regular | |
| // library (e.g. Underscore, jQuery is available), use that | |
| // instead. We keep this here to minimize dependencies in the | |
| // example. | |
| function debounce(fn, delay) { | |
| var timeout, args, context, timestamp, result; | |
| var now = Date.now || function() { | |
| return new Date().getTime(); | |
| }; | |
| var later = function() { | |
| var last = now() - timestamp; | |
| if (last < delay && last >= 0) { | |
| timeout = setTimeout(later, delay - last); | |
| } else { | |
| timeout = null; | |
| result = fn.apply(context, args); | |
| if (!timeout) context = args = null; | |
| } | |
| }; | |
| return function() { | |
| context = this; | |
| args = arguments; | |
| timestamp = now(); | |
| if (!timeout) { | |
| timeout = setTimeout(later, delay); | |
| } | |
| return result; | |
| }; | |
| }; | |
| // Handle window resize events. | |
| var onResize = debounce(function() { draw(sel, false); }, 33); | |
| // Code that actually draws the chart(s) in the selection(s). | |
| // The second parameter indicates whether or not to use | |
| // transitions in updating the chart. | |
| function draw(selection, useTransitions) { | |
| selection.each(function(data) { | |
| // Calculate display dimensions to ensure that the entire | |
| // chart fits within the browser window. We include a 20px | |
| // buffer to accomodate scroll bars. | |
| var displayW = Math.min(width, window.innerWidth-20), | |
| displayH = Math.min(height, window.innerHeight-20); | |
| // Calculate the dimensions of the chart itself by factoring | |
| // out the margins. | |
| var chartW = displayW - margin.left - margin.right, | |
| chartH = displayH - margin.top - margin.bottom; | |
| // Create a scale for the x-axis. Since this is a bar chart, | |
| // we use an ordinal scale. The data set is assumed to have | |
| // a `.label` property for each data value. | |
| var xScale = d3.scale.ordinal() | |
| .domain(data.map(function(d) { return d.label; })) | |
| .rangeRoundBands([0, chartW], 0.1); | |
| // Create a scale for the y-axis. A simple linear scale is | |
| // all we support, and we expect the values to be stored in | |
| // the `.value` propery of each data value. Note that we start | |
| // the axis at zero, regardless of the minimum value within | |
| // the data set. | |
| var yScale = d3.scale.linear() | |
| .domain([0, d3.max(data, function(d) { return d.value; })]) | |
| .range([chartH, 0]); | |
| // Let D3 construct both of the axes for the chart. | |
| var xAxis = d3.svg.axis() | |
| .scale(xScale) | |
| .orient("bottom"); | |
| var yAxis = d3.svg.axis() | |
| .scale(yScale) | |
| .orient("left"); | |
| // If we haven’t yet created the SVG container for the chart, | |
| // now is a good time. (The container will already exist if we’re | |
| // merely updating a chart, in which case we don’t need to create | |
| // it again.) | |
| if (!svg) { | |
| svg = d3.select(this) | |
| .append("svg"); | |
| // Since we had to create the SVG element, we also need | |
| // to create the child containers for the chart. We | |
| // use a main `<g>` group within the main SVG element to | |
| // easily accomodate the margins. That group is the primary | |
| // chart container. Within the chart container are three | |
| // subgroups: the chart itself, and the x- and y-axes. | |
| var container = svg.append("g").classed("container", true); | |
| container.append("g").classed("chart", true), | |
| container.append("g").classed("axis xaxis", true), | |
| container.append("g").classed("axis yaxis", true); | |
| } | |
| // Now that we have an SVG element on the page, make it visible. | |
| svg[useTransitions ? "transition" : "interrupt"]() | |
| .attr({width: displayW, height: displayH}); | |
| // Include the margins. | |
| d3.select(".container") | |
| .attr({transform: "translate(" + margin.left + "," + margin.top + ")"}); | |
| // Show the axes | |
| d3.select(".xaxis")[useTransitions ? "transition" : "interrupt"]() | |
| .attr({transform: "translate(0," + (chartH) + ")"}) | |
| .call(xAxis); | |
| d3.select(".yaxis")[useTransitions ? "transition" : "interrupt"]() | |
| .call(yAxis); | |
| // Add or update the data | |
| var bars = d3.select(".chart") | |
| .selectAll(".bar") | |
| .data(data); | |
| // New data is initially added to the far right of the | |
| // chart (i.e. stage-right). We transition it to the | |
| // appropriate x-position as part of the update selection | |
| // below. | |
| bars.enter() | |
| .append("rect") | |
| .classed("bar", true) | |
| .attr({ | |
| x: chartW, // off stage to the right | |
| width: xScale.rangeBand(), | |
| y: function(d) { return yScale(d.value); }, | |
| height: function(d) { return chartH - yScale(d.value); } | |
| }); | |
| // Now handle data whose value has changed as well as the | |
| // newly added values. We use a transition to move the | |
| // bars into their new position and adjust their heights | |
| // and widths. | |
| bars[useTransitions ? "transition" : "interrupt"]() | |
| .attr({ | |
| width: xScale.rangeBand(), | |
| x: function(d) { return xScale(d.label); }, | |
| y: function(d) { return yScale(d.value); }, | |
| height: function(d) { return chartH - yScale(d.value); } | |
| }); | |
| // Finally, deal with values that are no longer present in | |
| // the data. We use a transition to fade these bars out and | |
| // then remove them from the DOM. | |
| bars.exit()[useTransitions ? "transition" : "interrupt"]() | |
| .style({ | |
| opacity: 0 | |
| }) | |
| .remove(); | |
| }); | |
| }; | |
| // Public implementation | |
| // -------------------- | |
| function exports(selection, useTransitions) { | |
| sel = selection; | |
| draw(selection, (typeof useTransitions === "undefined") || useTransitions); | |
| }; | |
| // Public methods | |
| // -------------- | |
| exports.width = function(x) { | |
| if (!arguments.length) return width; | |
| width = parseInt(x); | |
| return this; | |
| }; | |
| exports.height = function(x) { | |
| if (!arguments.length) return height; | |
| height = parseInt(x); | |
| return this; | |
| }; | |
| exports.remove = function() { | |
| if (svg) { svg.remove(); } | |
| window.removeEventListener("resize", onResize); | |
| } | |
| // Initialization | |
| // -------------- | |
| // List for window resize events to adjust the chart | |
| // size if it won't fit. | |
| window.addEventListener("resize", onResize); | |
| // Return the object with public methods exposed | |
| return exports; | |
| }; |
This file contains bidirectional Unicode text that may be interpreted or compiled differently than what appears below. To review, open the file in an editor that reveals hidden Unicode characters.
Learn more about bidirectional Unicode characters
| // The test setup differs depending on whether the test is | |
| // executing in a browser or node.js environment. The following | |
| // conditional is a bit ugly, but it seems to be the most | |
| // reliable way to distinguish browser and node.js environments. | |
| var inBrowser = (typeof exports === 'undefined' || this.exports === exports) | |
| if (!inBrowser) { | |
| // Since we're running within node.js, we don't have the | |
| // traditional browser environment (i.e. window, document, etc.). | |
| // Use (an old version of) the jsdom library to mock that | |
| // environment. (Newer versions of jsdom only work with io.js, | |
| // but we can make do with the older version.) | |
| var jsdom = require('jsdom').jsdom; | |
| global.document = jsdom('<html><head><title></title></head><body></body></html>'); | |
| global.window = document.defaultView;; | |
| // Browser-based tests will include the D3.js library, but we | |
| // need to explicitly require it in node.js. | |
| global.d3 = require('d3'); | |
| // We also need to explicitly require the testing support | |
| // libraries in node.js | |
| global.chai = require('chai'); | |
| } | |
| // Everything from here on is common to both browser and node.js | |
| // testing environments. | |
| var should = chai.should(); | |
| describe("Custom Bar Chart Module", function() { | |
| it("creates an object for its name space", function() { | |
| should.exist(d3.custom.barChart) | |
| }) | |
| describe("Constructor", function() { | |
| beforeEach(function() { | |
| this.chart = new d3.custom.barChart(); | |
| }) | |
| afterEach(function() { | |
| this.chart.remove(); | |
| }) | |
| it("returns a function", function() { | |
| this.chart.should.be.a("function") | |
| }) | |
| }) | |
| describe("Configuration API", function() { | |
| beforeEach(function() { | |
| this.chart = new d3.custom.barChart(); | |
| }) | |
| afterEach(function() { | |
| this.chart.remove(); | |
| }) | |
| it("provides a method for configuring width", function() { | |
| this.chart.width.should.be.a("function") | |
| }) | |
| it("supports method chaining when configuring width", function() { | |
| this.chart.width(1).should.equal(this.chart) | |
| }) | |
| it("supports configuring width", function() { | |
| this.chart.width(1).width().should.equal(1) | |
| }) | |
| it("provides a method for configuring height", function() { | |
| this.chart.height.should.be.a("function") | |
| }) | |
| it("supports method chaining when configuring height", function() { | |
| this.chart.height(1).should.equal(this.chart) | |
| }) | |
| it("supports configuring height", function() { | |
| this.chart.height(1).height().should.equal(1) | |
| }) | |
| }) | |
| describe("Graph Rendering", function() { | |
| beforeEach(function() { | |
| this.chart = d3.custom.barChart() | |
| .height(500) | |
| .width(500); | |
| this.data = [ | |
| {label: "A", value: 20}, | |
| {label: "B", value: 30}, | |
| {label: "C", value: 40} | |
| ]; | |
| this.fixture = d3.select("body").append("div") | |
| .style({position: "absolute", left: "-99999px"}); | |
| this.fixture.datum(this.data).call(this.chart); | |
| }) | |
| afterEach(function() { | |
| this.chart.remove(); | |
| this.fixture.remove(); | |
| }) | |
| it("inserts parent <svg>", function() { | |
| this.fixture.selectAll("svg").size().should.equal(1) | |
| }) | |
| it("inserts x- and y-axes", function() { | |
| this.fixture.selectAll("g.axis.xaxis").size().should.equal(1) | |
| this.fixture.selectAll("g.axis.yaxis").size().should.equal(1) | |
| }) | |
| it("inserts bars for each data value", function() { | |
| this.fixture.selectAll("rect.bar").size().should.equal(3) | |
| }) | |
| it("sets bar heights correctly", function() { | |
| this.fixture.selectAll("rect.bar:nth-of-type(1)").attr("height").should.equal("200") | |
| this.fixture.selectAll("rect.bar:nth-of-type(2)").attr("height").should.equal("300") | |
| this.fixture.selectAll("rect.bar:nth-of-type(3)").attr("height").should.equal("400") | |
| }) | |
| it("sets bar baseline positions correctly", function() { | |
| this.fixture.selectAll("rect.bar:nth-of-type(1)").attr("y").should.equal("200") | |
| this.fixture.selectAll("rect.bar:nth-of-type(2)").attr("y").should.equal("100") | |
| this.fixture.selectAll("rect.bar:nth-of-type(3)").attr("y").should.equal("0") | |
| }) | |
| it("sets bar widths correctly", function() { | |
| this.fixture.selectAll("rect.bar:nth-of-type(1)").attr("width").should.equal("116") | |
| this.fixture.selectAll("rect.bar:nth-of-type(2)").attr("width").should.equal("116") | |
| this.fixture.selectAll("rect.bar:nth-of-type(3)").attr("width").should.equal("116") | |
| }) | |
| it("initially positions bars right of chart", function() { | |
| this.fixture.selectAll("rect.bar:nth-of-type(1)").attr("x").should.equal("400") | |
| this.fixture.selectAll("rect.bar:nth-of-type(2)").attr("x").should.equal("400") | |
| this.fixture.selectAll("rect.bar:nth-of-type(3)").attr("x").should.equal("400") | |
| }) | |
| if (inBrowser) { // D3 transitions don't work in node.js :( | |
| it("transitions bars to correct horizontal position", function(done) { | |
| this.slow(1000) | |
| setTimeout((function() { | |
| this.fixture.selectAll("rect.bar:nth-of-type(1)").attr("x").should.equal("13") | |
| this.fixture.selectAll("rect.bar:nth-of-type(2)").attr("x").should.equal("142") | |
| this.fixture.selectAll("rect.bar:nth-of-type(3)").attr("x").should.equal("271") | |
| done(); | |
| }).bind(this), 300) | |
| }) | |
| } | |
| }) | |
| describe("Graph Rendering (without transitions)", function() { | |
| beforeEach(function() { | |
| this.chart = d3.custom.barChart() | |
| .height(500) | |
| .width(500); | |
| this.data = [ | |
| {label: "A", value: 20}, | |
| {label: "B", value: 30}, | |
| {label: "C", value: 40} | |
| ]; | |
| this.fixture = d3.select("body").append("div") | |
| .style({position: "absolute", left: "-99999px"}); | |
| this.fixture.datum(this.data).call(this.chart, false); | |
| }) | |
| afterEach(function() { | |
| this.chart.remove(); | |
| this.fixture.remove(); | |
| }) | |
| it("sets bars to correct horizontal position", function() { | |
| this.fixture.selectAll("rect.bar:nth-of-type(1)").attr("x").should.equal("13") | |
| this.fixture.selectAll("rect.bar:nth-of-type(2)").attr("x").should.equal("142") | |
| this.fixture.selectAll("rect.bar:nth-of-type(3)").attr("x").should.equal("271") | |
| }) | |
| }) | |
| describe("Window Resize", function() { | |
| beforeEach(function() { | |
| this.chart = d3.custom.barChart() | |
| .height(500) | |
| .width(500); | |
| this.data = [ | |
| {label: "A", value: 20}, | |
| {label: "B", value: 30}, | |
| {label: "C", value: 40} | |
| ]; | |
| this.fixture = d3.select("body").append("div") | |
| .style({position: "absolute", left: "-99999px"}); | |
| this.fixture.datum(this.data).call(this.chart, false); | |
| }) | |
| afterEach(function() { | |
| this.chart.remove(); | |
| this.fixture.remove(); | |
| }) | |
| it("limits graph size to window", function(done) { | |
| this.slow(200) | |
| this.chart.width(50000).height(50000) | |
| // Old-style events for older jsdom; can't use | |
| // `window.dispatchEvent(new Event('resize'))` | |
| var evt = window.document.createEvent('UIEvents'); | |
| evt.initUIEvent('resize', true, false, window, 0); | |
| window.dispatchEvent(evt); | |
| setTimeout((function() { | |
| this.fixture.select("svg").attr("height").should.be.below(2000) | |
| this.fixture.select("svg").attr("width").should.be.below(2000) | |
| done() | |
| }).bind(this), 40) | |
| }) | |
| it("debounces resize event", function(done) { | |
| this.fixture.select("svg").attr("height").should.equal("500") | |
| this.fixture.select("svg").attr("width").should.equal("500") | |
| this.chart.width(50000).height(50000) | |
| // Old-style events for older jsdom; can't use | |
| // `window.dispatchEvent(new Event('resize'))` | |
| var evt = window.document.createEvent('UIEvents'); | |
| evt.initUIEvent('resize', true, false, window, 0); | |
| window.dispatchEvent(evt); | |
| setTimeout((function() { | |
| this.fixture.select("svg").attr("height").should.equal("500") | |
| this.fixture.select("svg").attr("width").should.equal("500") | |
| done() | |
| }).bind(this), 0) | |
| }) | |
| }) | |
| describe("Data Updates", function() { | |
| beforeEach(function() { | |
| this.chart = d3.custom.barChart() | |
| .height(500) | |
| .width(500); | |
| this.data = [ | |
| {label: "A", value: 20}, | |
| {label: "B", value: 30}, | |
| {label: "C", value: 40} | |
| ]; | |
| this.fixture = d3.select("body").append("div") | |
| .style({position: "absolute", left: "-99999px"}); | |
| this.fixture.datum(this.data).call(this.chart, false); | |
| }) | |
| afterEach(function() { | |
| this.chart.remove(); | |
| this.fixture.remove(); | |
| }) | |
| it("revises chart with new data", function() { | |
| this.newdata = [ | |
| {label: "A", value: 40}, | |
| {label: "B", value: 20}, | |
| {label: "C", value: 30} | |
| ]; | |
| this.fixture.datum(this.newdata).call(this.chart, false); | |
| this.fixture.selectAll("rect.bar:nth-of-type(1)").attr("height").should.equal("400") | |
| this.fixture.selectAll("rect.bar:nth-of-type(2)").attr("height").should.equal("200") | |
| this.fixture.selectAll("rect.bar:nth-of-type(3)").attr("height").should.equal("300") | |
| }) | |
| }) | |
| }) |
This file contains bidirectional Unicode text that may be interpreted or compiled differently than what appears below. To review, open the file in an editor that reveals hidden Unicode characters.
Learn more about bidirectional Unicode characters
| <!DOCTYPE html> | |
| <html> | |
| <head> | |
| <meta charset='utf-8'> | |
| <title>Automated testing for JavaScript-based Data Visualizations</title> | |
| <style> | |
| /* Some basic styles to make the chart visible */ | |
| body, h1, h2 { | |
| color: #444; | |
| font-family: 'Helvetica Neue', Helvetica, sans-serif; | |
| font-weight: 300; | |
| } | |
| .axis path, .axis line { | |
| fill: none; | |
| stroke: black; | |
| shape-rendering: crispEdges; | |
| } | |
| .axis path { | |
| fill: none; | |
| stroke: none; | |
| } | |
| .bar { | |
| fill: #007979; | |
| stroke: white; | |
| } | |
| </style> | |
| </head> | |
| <body> | |
| <div id='chart'><!-- --></div> | |
| <!-- For display on http://bl.ocks.org use the CDN instead of local D3 --> | |
| <script src='http://d3js.org/d3.v3.min.js'></script> | |
| <!-- <script src='node_modules/d3/d3.min.js'></script> --> | |
| <!-- For display in blog post full URL instead of local file --> | |
| <script src='http://jsDataV.is/data/barchart.js'></script> | |
| <!-- <script src='chart.js'></script> --> | |
| <script> | |
| var chart = d3.custom.barChart(); | |
| function randomDataset() { | |
| return d3.range(2 + Math.floor((Math.random() * 7))) | |
| .map(function(d) { | |
| return { | |
| label: String.fromCharCode(65+d), | |
| value: Math.floor(Math.random() * 1000) | |
| }; | |
| }); | |
| }; | |
| function update(data) { | |
| d3.select("#chart") | |
| .datum(data) | |
| .call(chart); | |
| }; | |
| update(randomDataset()); | |
| setInterval(function() {update(randomDataset())}, 10000); | |
| </script> | |
| </body> | |
| </html> |
This file contains bidirectional Unicode text that may be interpreted or compiled differently than what appears below. To review, open the file in an editor that reveals hidden Unicode characters.
Learn more about bidirectional Unicode characters
| { | |
| "name": "jsdatav.is-testing", | |
| "version": "1.0.0", | |
| "description": "Automated testing for JavaScript-based Data Visualizations", | |
| "repository": { | |
| "type": "git", | |
| "url": "https://gist.github.com/sathomas/dcb31c1de5940d2fca9c" | |
| }, | |
| "scripts": { | |
| "test": "mocha chart.test.js chart.js" | |
| }, | |
| "author": "Stephen Thomas <stephen@sathomas.me>", | |
| "license": "ISC", | |
| "dependencies": { | |
| "d3": "^3.5.6" | |
| }, | |
| "devDependencies": { | |
| "blanket": "^1.1.7", | |
| "chai": "^3.2.0", | |
| "jsdom": "3.1.2", | |
| "mocha": "^2.3.0" | |
| } | |
| } |

This file contains bidirectional Unicode text that may be interpreted or compiled differently than what appears below. To review, open the file in an editor that reveals hidden Unicode characters.
Learn more about bidirectional Unicode characters
| <!DOCTYPE html> | |
| <html> | |
| <head> | |
| <meta charset="utf-8"> | |
| <title>Automated testing for JavaScript-based Data Visualizations</title> | |
| <link href="node_modules/mocha/mocha.css" rel="stylesheet" /> | |
| </head> | |
| <body> | |
| <div id="mocha"></div> | |
| <script src="node_modules/chai/chai.js"></script> | |
| <script src="node_modules/mocha/mocha.js"></script> | |
| <script src="node_modules/blanket/dist/mocha/blanket_mocha.js"></script> | |
| <script src='node_modules/d3/d3.min.js'></script> | |
| <script src='chart.js' data-cover></script> | |
| <script> | |
| mocha.setup('bdd') | |
| mocha.checkLeaks(); | |
| mocha.globals(['D3']); | |
| </script> | |
| <script src='chart.test.js'></script> | |
| <script> | |
| mocha.run(); | |
| </script> | |
| </body> | |
| </html> |
This file contains bidirectional Unicode text that may be interpreted or compiled differently than what appears below. To review, open the file in an editor that reveals hidden Unicode characters.
Learn more about bidirectional Unicode characters
| http://jsdatav.is/img/thumbnails/testing.png |

Sign up for free
to join this conversation on GitHub.
Already have an account?
Sign in to comment