Created
September 16, 2017 14:57
-
-
Save mtreg/e86c516a4ace3ec54e8bd36bcd9da875 to your computer and use it in GitHub Desktop.
Acquire and Crop Specific TopoWx Subsets of Daily Data in R
This file contains bidirectional Unicode text that may be interpreted or compiled differently than what appears below. To review, open the file in an editor that reveals hidden Unicode characters.
Learn more about bidirectional Unicode characters
| ####This code allows pulling of daily TopoWx data from an OpenDap server, coarsely selecting specific days | |
| ####Opendap Access form at: https://cida.usgs.gov/thredds/dodsC/topowx.html | |
| ####for ncdf4 to pull from OpenDap, cannot be run on windows unless specifically compiled for such; | |
| ####see notes in this thread: https://stat.ethz.ch/pipermail/r-help/2015-July/430161.html | |
| #Load necessary packages | |
| library(raster) | |
| library(ncdf4) | |
| #Set call to dataset via OpenDap | |
| topowx.url <- "https://cida.usgs.gov/thredds/dodsC/topowx" | |
| #"load" data into R via Raster package | |
| tmax <- brick(topowx.url, varname="tmax", ncdf=TRUE) | |
| #Set bounding box desired for cropping the image | |
| bb1 <- extent(-80,-70,40,45.2) | |
| #To call specific dates by layer index and crop to desired bounding box: | |
| test1 <- crop(tmax[[1:2]], bb1) | |
| #To call specific dates based on range using appropriate slot, and crop to desired bounding box: | |
| test2 <- crop(tmax[[which(tmax@z$Date < "1950-05-11" & tmax@z$Date > "1950-05-01")]], bb1) |
Glad you solved it! Here's another approach, a bit awkward as it still uses raster to get the upfront metadata, but this minimizes the actual amount of data that gets pulled down.
https://github.com/hypertidy/tidync
## a very different approach, using a mix of raster/tidync (in-dev :)
library(raster)
library(ncdf4)

#Set call to dataset via OpenDap
topowx.url <- "https://cida.usgs.gov/thredds/dodsC/topowx"

# note this only reads the metdata, no actual data
tmax <- brick(topowx.url, varname="tmax",  ncdf=TRUE)
## this polls the metadata for just the "time" dimension
Date <- getZ(tmax)
## but only use that to get the index for Date
date_ind <- which(Date < as.Date("1950-05-11") & Date > as.Date("1950-05-01"))
bb1 <- extent(-80,-70,40,45.2)

library(tidync)
tmax_source <- tidync(topowx.url)
## print the source so we know what names we need
print(tmax_source %>% hyper_filter())

## set up a crop
library(dplyr)
tmax_crop <- tmax_source %>%
  hyper_filter(lon = between(lon, xmin(bb1), xmax(bb1)),
               lat = between(lat, ymin(bb1), ymax(bb1)),
               ## note we have to use the special name "index" which
               ## each axis has, we need it because tidync is not unit-aware yet
               time = between(index, min(date_ind), max(date_ind)))

## see how the hyper_index tells us the lower level start/count we need for the source
print(tmax_crop %>% hyper_index())
## use that to now break the delay and pull the data
## we are now all in R memory, having avoided raster's inability to crop time and space
## in one fast step
data_list <- tmax_crop %>% hyper_slice(select_var = "tmax")
## now construct the brick (phew)
tmax <- setExtent(brick(data_list[["tmax"]], transpose = TRUE), bb1)
tmax <- setZ(Date[date_ind])
I'd like to see raster incorporate this approach, but it can't apply this to more arbitrary or higher-dimension grids, at any rate tidync will get more functional over time.
Sign up for free
to join this conversation on GitHub.
Already have an account?
Sign in to comment
Examples of results when plotted:
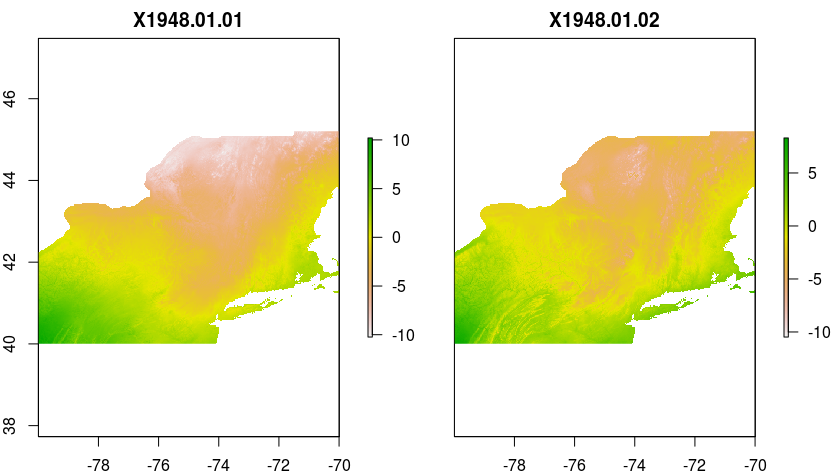
plot(test1)plot(test2)