Skip to content

Instantly share code, notes, and snippets.

@tomgp
Last active July 6, 2018 14:49
Show Gist options
  • Star 0 You must be signed in to star a gist
  • Fork 0 You must be signed in to fork a gist
  • Save tomgp/bead4692d3903ea057780b9d2fdfb164 to your computer and use it in GitHub Desktop.
Save tomgp/bead4692d3903ea057780b9d2fdfb164 to your computer and use it in GitHub Desktop.
Radial stack layout

In response to this stack overflow question

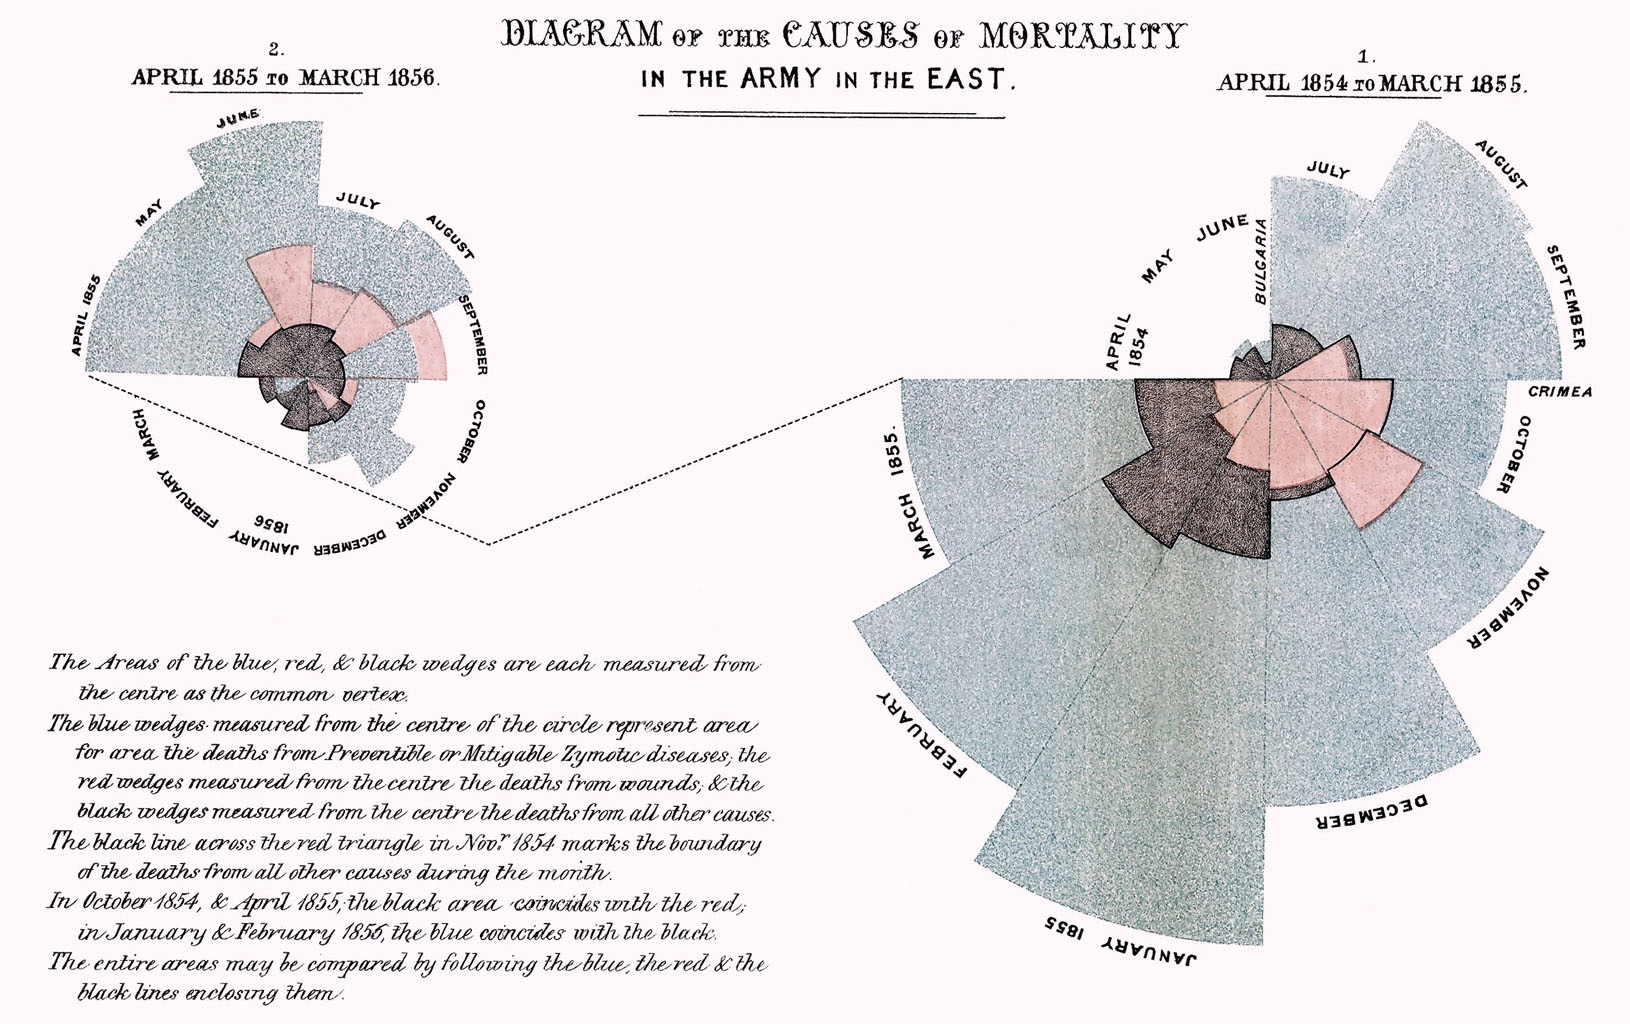
This type of chart is also sometimes known as a sector diagram. The most famous example of a similar layout is probaly Florence Nightingale's "coxcomb" diagrams though in her version the sectors aren't stacked, they're all measured form the center and the areas are proportional to values not distances (I was too lazy to calculate those).

NOTE

This isn't a great visualisation as it stands: The data values are proportional to the thickness of the arcs rather than their area giving values appearing later in an array undue visual weight. In order to do a better job you'd need to work out the appropriate area for a given segment then work backwards to determine it's thickness given where it starts (radially speaking). This is left as an excercise for the reader.

<html>
<head>
<style>
body{
font-family:sans-serif;
}
</style>
<script src="https://cdnjs.cloudflare.com/ajax/libs/d3/5.5.0/d3.min.js"></script>
</head>
<body>
<svg></svg>
</body>
<script>
const rawData = [
{year:2018, data:[15,7,35]},
{year:2017, data:[10,20,30]},
{year:2016, data:[20,20,30]},
{year:2015, data:[5,40,3]},
{year:2014, data:[25,12,9]},
];
const colours = [ '#000000','#EB4125','#0031F5' ];
const width=600, height=600;
const stackSegments = radialStackLayout(rawData, Math.min(width,height)/2);
const arc = d3.arc();
d3.select('svg')
.attr('width', width)
.attr('height', height)
.append('g')
.attr('transform',`translate(${width/2},${height/2})`)
.selectAll('path.segment')
.data(stackSegments)
.enter()
.append('path')
.attr('d', d=>arc(d))
.attr('fill', d=>d.fill);
/* the radialStackLayout function converts the data into a set of arc segment definitions */
function radialStackLayout(data, radius){
const angularScale = d3.scaleLinear()
.range([0, 2*Math.PI])
.domain([0, data.length])
const biggestStack = data.reduce(
(maxValue, currentArray) => {
return Math.max(d3.sum(currentArray.data), maxValue)
},0);
const stackScale = d3.scaleLinear()
.range([0, radius])
.domain([0, biggestStack]);
const layoutElements = [];
data.forEach((d, i)=>{
let stackHeight = 0;
d.data.forEach((datum,j)=>{
layoutElements.push({
data: { year: d.year, value: datum }, // retain the original data potentially useful for things like tooltips
innerRadius: stackHeight,
outerRadius: stackHeight + stackScale(datum),
startAngle: angularScale(i),
endAngle: angularScale(i+1),
fill:colours[j]
});
stackHeight = stackHeight + stackScale(datum);
})
});
return layoutElements;
}
d3.select(self.frameElement).style("height", height + "px");
</script>
</html>
Sign up for free to join this conversation on GitHub. Already have an account? Sign in to comment