NYC had an import of over 1 million building footprints and 900,000 addresses in 2014 from the New York City Department of Information Technology and Telecommunications (DoITT). The DoITT GIS releases an updated shapefile of the footprints every quarter, and the latest version can be accessed here: Building footprints | Address points
Open datasets like these are a great opportunity to explore how OSM can be used as a bridge between authoritative information and that crowdsourced by citizens. Two years after the import, it is interesting to see how the OSM data compares with the latest official footprints. The interesting questions to ask is:
- What has improved in the DoITT footprints that can be updated in OSM?
- What has improved in OSM that can be updated in the DoITT data?
Both of these are pretty challenging questions and requires some careful data comparison and conflation. manings and I were trying our hand at answering these questions and here is our progress.
Grab the latest NYC footprints from DoITT and the NYC OSM extract from Mapzen.
Use QGIS to filter only the buildings from the OSM extract and save it as a separate shapefiles to make the analysis slightly faster.
A simple way to quickly see a difference between the geometries in the two datasets is to do a visual diff by overlapping the layers with different colors. Geometries that don't overlap will show the color of the underlying layer.

Green=missing in DoITT; Yellow= OSM overlaps DoITT; Red=missing in OSM. (interactive map)
This is a purely visual comparison and with some eyeballing, we noticed not much has changed. The green buildings on the New Jersey side are outside the import area and do not exist in the DoiTT dataset. We know have a few more questions that lie unanswered:
- Why are there missing buildings in the latest DoiTT data, is it because OSM more updated, or have the buildings been demolished and OSM is outdated?
- Why are there missing buildings in OSM? Were they demolished and deleted, or were they never they never added in the first place?
Both the above questions can be answered if we know which dataset is more updated, and the only reliable method to find out is to visit the site and ground truth the information.
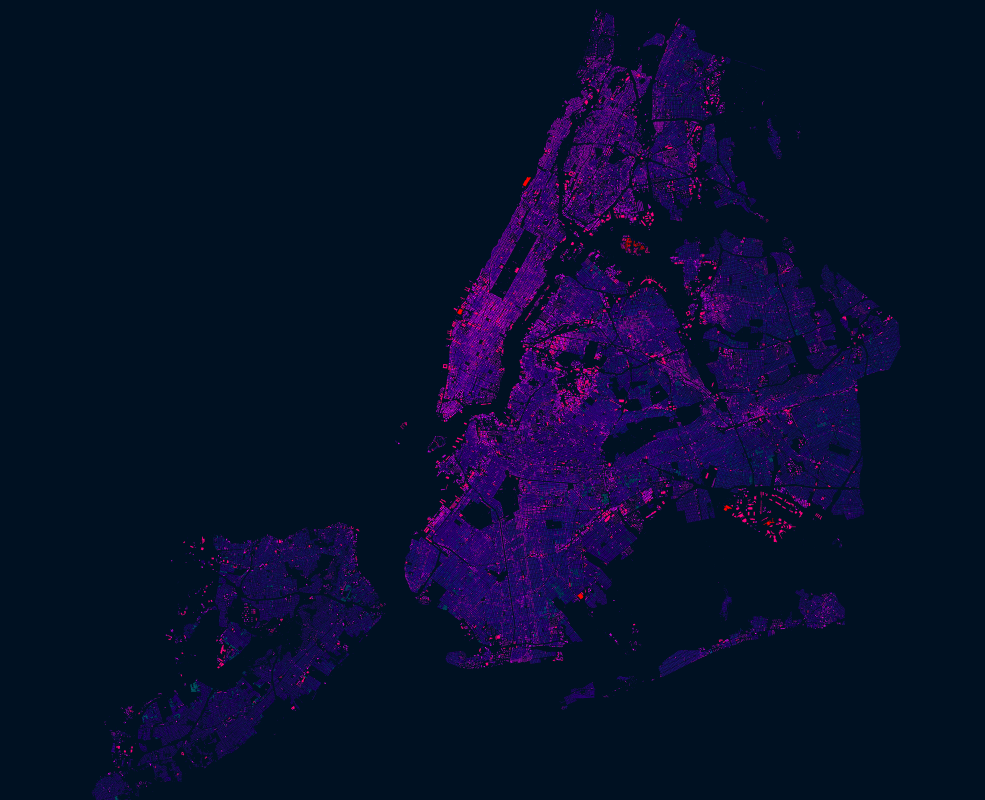
Next we will try to detect changes in building configurations, where buildings might have combined or been split from its parent. This can be done by comparing the centroids of the two footprint datasets and check if they match. To do this, we can first extract the centroid of all the OSM footprints, and using a point in polygon analysis, find out how many centroid intersect with every DoITT footprint.

Black=0 OSM footprints at location; Grey=1 OSM footprint at location; Yellow= 2 OSM footprints at location; Red=2+ OSM footprints at location

This method can isolate the footprints that need to be added into OSM, but its not a simple insertion as there may be cases where a single building might need to be split into smaller buildings

This also detected overlapping polygons in OSM, and cases where multiple buildings need to be combined into larger buildings

In cases where the buildings have transformed their shape drastically, the centroid may not overlap and get flagged as a missing building
 Minor shape changes don't get flagged
Stats
- Total footprints in DoITT dataset: 1,082,433
- No existing OSM footprint at location (PNTCNT=0): 1,223 footprints to add
- 1 existing OSM footprint at location (PNTCNT=1): 1,072,975 footprints not changed or with minor geometry changes
- 2 existing OSM footprints at location (PNTCNT=2): 1,661 footprints to be merged or updated
- More than 2 existing OSM footprints at location (PNTCNT>2): 251 footprints to be merged or updated
The above analysis can still miss out on minor shape changes. To find out which buildings were modified since the last import, we tried to compare shape changes using the nycdoitt:bin footprint id as primary reference key.
For each nycdoitt:bin polygon from OSM and NYC:
- compute the perimeter and area.
- get the absolute difference between both polygons.
This process confirms the centroid diffs in our test area and can further identify shape changes where, the buildings were not deleted/added but shapes were improved, etc.
This is only true if the nycdoitt:bin id has not changed. However, we noticed that the building id from the NYC changes a lot and is not unique to each building. For example, in our test area, we found many duplicate entries (i.e. 1000000 = 106; 2000000 = 1482; 3000000 = 2052; 4000000 = 10119; 5000000 = 2623). Taginfo confirms this thus, using the nycdoitt:bin id is not the best approach to do this comparison.
This exploration is continuing, and we want to share our initial attempt and difficulties (!). As more and more people use OSM and external goes into the database we need to find ways to do comparison and feed changes both from OSM and into the external databases.